Aurora Forecast
The chart below shows data from the USAF 15-minute Wing Kp Geomagnetic Activity Index data set which predicts aurora activity in 15 minute increments for the next hour. Kp values are estimated as with any type of forecast, but this data is the most reliable and accurate available.
Aurora Activity Tracker
NOAA updates this data set is every 2 minutes, so you can check back often and get the latest update on the current and predicted Kp values.
Kp Index
The Kp index is the global geomagnetic storm index and ranges from 0 to 9, where a value of 0 means little activity and a value of 9 means an extreme geomagnetic storm.
This table shows an immediate idea what the most recently measured geomagnetic conditions are and a forecast for the next hour. Note that forecasts are not guaranteed to be accurate, as auroral activity is notoriously difficult to predict due to sub-storms, local flareups, etc. There’s always a possibility that the numbers in the chart may not reflect what you see in the sky.
For more information on the Kp and G indices and what they mean, go to my Aurora Information page.
OVATION
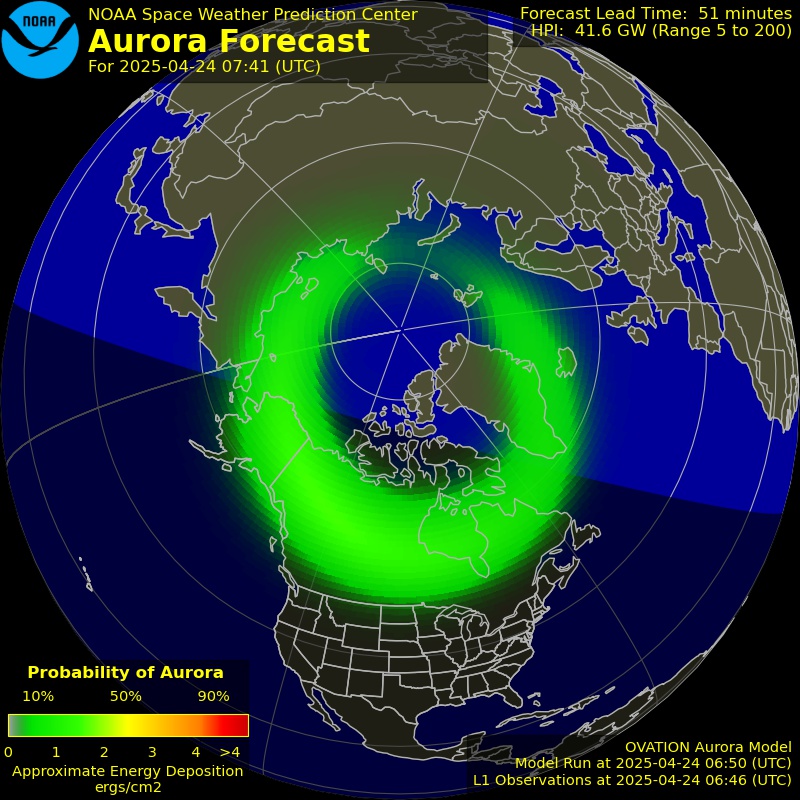
The most accurate way to tell if an aurora is occurring is to view the OVATION map by the by the National Oceanic and Atmospheric Administration (NOAA). If you want to see if the aurora will be visible from your current location, this is the definitive tool to use. See below the image for an explanation of how to use the map.
How to use the OVATION map
The map is centred on North America, but can be used by any location in the northern hemisphere. You’ll see a band of green colour circling the North Pole. As the Kpindex values increase, the band will get wider and start showing hues of yellow, orange, or even red. The legend at the bottom left explains how the colour scheme works. Dull, dark greens indicate low aurora activity, whereas yellow, orange or red show strong geomagnetic activity. The more intense the Kp value, the wider and brighter the band will be, indicating a strong aurora. And of course, the wider the band, the farther south the aurora will be visible.
IMPORTANT!!! The areas on the map covered by the auroral band are where the aurora can be seen overhead. Aurorae occur between 100 and 300 km (60-200 miles) altitude. If there’s a lot of orange and red, you’ll be able to see the aurora much farther south than what is covered on the map. You’ll be able to see it several hundred kilometers south of what’s shown on the map, albeit on the northern horizon vs overhead.
What is the OVATION Model
The OVATION model predicts the position and strength of the aurora based on measurements from Lagrange point 1 (L1), a position about 1.5 million km between Earth and the Sun. The forecast is based on current solar wind conditions with a fixed 30-minute delay time between L1 and Earth. This 30-minute delay corresponds to approximately an average 800 km/s solar wind speed encountered during geomagnetic storming conditions. The actual time delay can be from anywhere from a few minutes to an hour or more since the delay is based on an average value for a mid-level storm.
Moon Conditions
The key to being able to see aurora clearly is dark skies away from light pollution and with little to no moon in the sky. While it may be possible to see intense aurora under moon light (my pic on this page shows an intense aurora under a 90% moon), it will likely be mostly invisible or very underwhelming under bright conditions. There really is no substitute for dark skies.
Current Moon Information
